These Solar System minor planets are the farthest from the Sun as of June 2021. The objects have been categorized by their approximate current distance from the Sun, and not by the calculated aphelion of their orbit. The list changes over time because the objects are moving. Some objects are inbound and some are outbound. It would be difficult to detect long-distance comets if it were not for their comas, which become visible when heated by the Sun. Distances are measured in astronomical units (AU, Sun–Earth distances). The distances are not the minimum (perihelion) or the maximum (aphelion) that may be achieved by these objects in the future.

Positions of known outer Solar System objects
Sun
Jupiter trojans (6,178)
Scattered disc (>300) Giant planets: J · S · U · N
Centaurs (44,000)
Kuiper belt (>1,000)
(scale in AU; epoch as of January 2015; # of objects in parentheses)
This list does not include near-parabolic comets of which many are known to be currently more than 100 AU (15 billion km) from the Sun, but are currently too far away to be observed by telescope. Trans-Neptunian objects are typically announced publicly months or years after their discovery, so as to make sure the orbit is correct before announcing it. Due to their greater distance from the Sun and slow movement across the sky, trans-Neptunian objects with observation arcs less than several years often have poorly constrained orbits. Particularly distant objects take several years of observations to establish a crude orbit solution before being announced. For instance, the most distant known trans-Neptunian object 2018 AG37 was discovered by Scott Sheppard in January 2018 but was announced three years later in February 2021.[1]
Noted objectsEditOne particularly distant body is 90377 Sedna, which was discovered in November 2003. Although it takes over 10,000 years to orbit, during the next 50 years it will slowly move closer to the Sun as it comes to perihelion at a distance of 76 AU from the Sun.[2] Sedna is the largest known sednoid, a class of objects that play an important role in the Planet Nine hypothesis.
Pluto (30–49 AU, about 34 AU in 2015) was the first Kuiper belt object to be discovered (1930) and is the largest known dwarf planet.
GalleryEdit- Notable trans-Neptunian objects
Halley's Comet imaged by the VLT at magnitude 28 when the object was located 28 AU from the Sun in 2003
Eris and its moon Dysnomia as viewed with the Hubble Space Telescope, 2007
Makemake viewed with the Hubble Space Telescope, 2006
Sedna viewed with Hubble Space Telescope, 2004
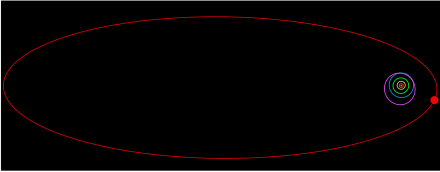
The orbit of Sedna, shown in red, with the dot marking its current location. Inside are the orbits of the giant planets of the Solar System, and that of Pluto in purple. Sedna will travel out nearly 1000 AU, taking almost six millennia to do so. It is currently less than 100 AU from the Sun.
This is a list of known objects at heliocentric distances of more than 60 AU. In theory, the Oort Cloud could extend over 120,000 AU (2 ly) from the Sun.
Most distant observable objects in the Solar System as of June 2021[3]| Object name | Distance from the Sun (AU) | Radial velocity
(AU/yr)[a] | Perihelion | Aphelion | Semimajor
axis | Apparent
magnitude | Absolute
magnitude (H) | Important dates |
|---|
| June 2021 | December 2015 | Discovered | Announced |
|---|
Great Comet of 1680
(for comparison) | 258.0[4] | 255.4[4] | +0.47[4] | 0.006 | 889 | 444 | Unknown | Unknown | 1680-11-14 | n/a |
Voyager 1
(for comparison) | 152.9[4] | 133.3[4] | +3.57[4] | 8.90 | ∞
Hyperbolic | −3.2[5] | ~50 | ~28 | n/a | n/a |
| 2018 AG37 | 132.9±1.8 | 131.9±10.7 | ±0.2(?) | 27.1 | 145.0 | 86.0 | 25.4 | 4.2 | 2018-01-15 | 2021-02-10 |
|---|
Pioneer 10
(for comparison) | 128.6[4] | 114.8[4] | +2.51[4] | 4.94 | ∞
Hyperbolic | | ~49 | ~29 | n/a | n/a |
Voyager 2
(for comparison) | 127.2[4] | 109.7[4] | +3.17[4] | 21.2 | ∞
Hyperbolic | −4.0[5] | ~48 | ~28 | n/a | n/a |
| 2018 VG18 | 123.6 | 123.2 | +0.06 | 37.8 | 123.9 | 81.3 | 24.6 | 3.7 | 2018-11-10 | 2018-12-17 |
|---|
Pioneer 11
(for comparison) | 105.5[4] | 92.5[4] | +2.35[4] | 9.45 | ∞
Hyperbolic | | ~48 | ~29 | n/a | n/a |
| 2020 FY30 | 98.9 | 99.9 | –0.17 | 35.6 | 107.7 | 71.6 | 24.8 | 4.7 | 2020-03-24 | 2021-02-14 |
|---|
| 2020 FA31 | 97.3 | 96.5 | +0.14 | 39.5 | 102.4 | 71.0 | 25.4 | 5.4 | 2020-03-24 | 2021-02-14 |
|---|
Eris
136199 | 95.9 | 96.3 | −0.07 | 38.3 | 97.5 | 67.9 | 18.8 | −1.1 | 2003-10-21 | 2005-07-29 |
|---|
| 2015 TH367[b] | 90.3 | 88.2 | +0.42 | 28.9 | 136.4 | 82.6 | 26.3 | 6.6 | 2015-10-13 | 2018-03-13 |
|---|
| 2014 UZ224 | 89.5 | 92.0 | −0.45 | 38.3 | 177.0 | 107.6 | 23.2 | 3.4 | 2014-10-21 | 2016-08-28 |
|---|
Gonggong
225088 | 88.7 | 87.4 | +0.23 | 33.7 | 101.2 | 67.5 | 21.5 | 1.6 | 2007-07-17 | 2009-01-07 |
|---|
| 2015 FG415 | 87.2 | 87.9 | −0.14 | 36.2 | 92.1 | 64.1 | 25.5 | 6.0 | 2015-03-17 | 2019-03-27 |
|---|
| 2014 FC69 | 85.5 | 84.1 | +0.26 | 40.4 | 104.4 | 72.4 | 24.2 | 4.6 | 2014-03-25 | 2015-02-11 |
|---|
| 2006 QH181 | 84.6 | 83.3 | +0.22 | 37.5 | 96.7 | 67.1 | 23.7 | 4.3 | 2006-08-21 | 2006-11-05 |
|---|
Sedna
90377 | 84.2 | 85.8 | −0.29 | 76.3 | 892.6 | 484.4 | 21.0 | 1.3 | 2003-11-14 | 2004-03-15 |
|---|
| 2015 VO166 | 84.3 | 82.5 | +0.32 | 38.3 | 113.2 | 75.8 | 25.5 | 5.9 | 2015-11-06 | 2018-10-02 |
|---|
| 2012 VP113 | 84.2 | 83.3 | +0.16 | 80.4 | 442.6 | 261.5 | 23.5 | 4.0 | 2012-11-05 | 2014-03-26 |
|---|
| 2013 FS28 | 83.5 | 85.9 | −0.62 | 34.2 | 358.2 | 196.2 | 24.3 | 4.9 | 2013-03-16 | 2016-08-29 |
|---|
| 2017 SN132 | 82.8 | 80.4 | +0.44 | 42.0 | 110.0 | 76.0 | 25.2 | 5.8 | 2017-09-16 | 2019-02-10 |
|---|
| 2015 UH87[b] | 81.3 | 82.3 | −0.19 | 34.3 | 90.0 | 62.2 | 25.2 | 6.0 | 2015-10-16 | 2018-03-12 |
|---|
2013 FY27
532037 | 79.7 | 80.3 | −0.10 | 35.2 | 82.1 | 58.7 | 22.2 | 3.2 | 2013-03-17 | 2014-03-31 |
|---|
| 2015 TJ367[b] | 79.4 | 77.1 | +0.42 | 33.6 | 128.1 | 80.9 | 25.8 | 6.7 | 2015-10-13 | 2018-03-13 |
|---|
| 2017 FO161 | 78.1 | 79.1 | −0.18 | 34.1 | 85.5 | 59.8 | 23.3 | 4.3 | 2017-03-23 | 2018-04-02 |
|---|
Leleākūhonua
541132 | 77.6 | 79.8 | −0.40 | 65.2 | 2,106 | 1,085 | 24.6 | 5.5 | 2015-10-13 | 2018-10-01 |
|---|
| 2018 AD39 | 77.2 | 74.1 | –0.58 | 38.4 | 287.9 | 163.2 | 25.0 | 6.2 | 2018-01-15 | 2021-02-13 |
|---|
| 2020 FB31 | 75.8 | 76.8 | –0.19 | 34.4 | 83.3 | 59.1 | 24.5 | 5.6 | 2020-03-24 | 2021-02-14 |
|---|
| 2018 AK39 | 75.3 | 75.4 | –0.01 | 27.3 | 75.4 | 51.4 | 25.3 | 6.5 | 2018-01-18 | 2021-02-18 |
|---|
| 2010 GB174 | 73.6 | 70.7 | +0.54 | 48.7 | 630.7 | 339.7 | 25.3 | 6.5 | 2010-04-12 | 2013-04-30 |
|---|
| 2015 VJ168 | 73.4 | 72.4 | +0.19 | 37.6 | 81.5 | 59.5 | 24.8 | 5.8 | 2015-11-06 | 2018-10-03 |
|---|
| 2014 FJ72 | 72.6 | 70.1 | +0.46 | 38.4 | 148.2 | 93.3 | 24.4 | 5.6 | 2014-03-24 | 2016-08-31 |
|---|
| 2016 TS97[b] | 71.2 | 71.5 | −0.04 | 36.2 | 71.7 | 54.0 | 24.9 | 6.1 | 2016-10-06 | 2018-04-02 |
|---|
| 2015 GN55 | 71.0 | 72.1 | −0.19 | 32.5 | 78.4 | 55.5 | 24.6 | 5.8 | 2015-04-13 | 2018-09-02 |
|---|
| 2015 VL168 | 69.7 | 72.1 | –0.44 | 37.7 | 136.0 | 86.8 | 24.7 | 6.1 | 2015-11-07 | 2018-10-03 |
|---|
| 2015 RZ277 | 69.3 | 67.5 | +0.32 | 34.7 | 90.5 | 62.6 | 25.6 | 6.8 | 2015-09-08 | 2018-10-01 |
|---|
| 2012 FH84 | 68.8 | 68.4 | +0.07 | 41.9 | 70.1 | 56.0 | 25.8 | 7.2 | 2012-03-25 | 2016-06-07 |
|---|
| 2019 AC77 | 68.7 | 69.9 | –0.21 | 35.0 | 79.0 | 57.0 | 25.0 | 6.6 | 2019-01-11 | 2021-02-14 |
|---|
| 2015 GR50 | 68.6 | 68.2 | +0.07 | 38.2 | 69.7 | 54.0 | 25.2 | 6.6 | 2015-04-13 | 2016-08-31 |
|---|
| 2013 FQ28 | 68.4 | 67.3 | +0.19 | 45.6 | 80.0 | 62.7 | 24.5 | 6.0 | 2013-03-17 | 2016-06-07 |
|---|
| 2011 GM89 | 68.3 | 68.5 | –0.24 | 36.5 | 68.8 | 52.7 | 25.7 | 7.1 | 2011-04-04 | 2016-08-31 |
|---|
| 2015 GP50 | 67.6 | 68.1 | –0.10 | 40.4 | 70.0 | 55.2 | 25.0 | 6.5 | 2015-04-14 | 2016-06-07 |
|---|
| 2016 CD289 | 67.2 | 66.2 | +0.18 | 37.5 | 74.0 | 55.8 | 25.7 | 7.3 | 2016-02-05 | 2018-03-13 |
|---|
| 2018 VJ137 | 67.2 | 69.7 | –0.46 | 37.8 | 139.3 | 88.5 | 25.2 | 6.9 | 2018-01-15 | 2021-02-13 |
|---|
| 2014 UD228 | 66.7 | 65.7 | +0.18 | 36.7 | 73.3 | 55.0 | 24.5 | 6.1 | 2014-10-22 | 2017-12-07 |
|---|
| 2016 GB277 | 66.2 | 68.3 | –0.39 | 40.0 | 119.4 | 79.7 | 25.6 | 7.3 | 2016-04-10 | 2020-06-04 |
|---|
| 2016 GZ276 | 66.1 | 69.2 | –0.56 | 38.6 | 253.6 | 146.1 | 25.3 | 7.0 | 2016-04-10 | 2020-06-03 |
|---|
| 2014 FL72 | 66.1 | 63.3 | +0.50 | 38.0 | 167.1 | 102.5 | 25.1 | 6.8 | 2014-03-26 | 2016-08-31 |
|---|
| 2016 TQ120[b] | 65.8 | 63.7 | +0.37 | 42.3 | 114.3 | 78.3 | 25.0 | 6.7 | 2016-10-06 | 2020-06-04 |
|---|
| 2015 RQ281 | 65.7 | 62.7 | +0.56 | 36.9 | 210.6 | 123.8 | 25.1 | 6.8 | 2015-09-05 | 2019-03-27 |
|---|
| 2020 BS60[b] | 65.7 | 68.0 | –0.42 | 31.0 | 104.1 | 67.6 | 24.6 | 6.5 | 2020-01-26 | 2021-02-23 |
|---|
| 2013 UJ15 | 65.4 | 64.8 | +0.11 | 37.2 | 67.4 | 52.3 | 25.4 | 7.0 | 2013-10-28 | 2016-08-31 |
|---|
| 2014 FD70 | 65.2 | 63.8 | +0.26 | 35.9 | 78.6 | 57.3 | 25.1 | 6.9 | 2014-03-25 | 2018-04-02 |
|---|
| 2018 AZ18 | 65.1 | 65.9 | –0.15 | 39.1 | 70.5 | 54.8 | 26.0 | 7.7 | 2018-01-15 | 2019-03-27 |
|---|
| 2015 KV167 | 65.0 | 65.2 | –0.03 | 38.0 | 65.3 | 51.6 | 25.6 | 7.2 | 2015-05-18 | 2018-03-13 |
|---|
| 2018 VO35 | 65.0 | 67.8 | –0.51 | 35.2 | 152.2 | 93.7 | 24.9 | 6.8 | 2018-11-10 | 2019-02-10 |
|---|
| 2014 FE72 | 64.8 | 60.8 | +0.72 | 36.3 | 2,682 | 1,359 | 24.4 | 6.1 | 2014-03-26 | 2016-08-29 |
|---|
| 2015 KG172 | 64.5 | 63.6 | +0.16 | 41.2 | 70.1 | 55.7 | 24.4 | 6.1 | 2015-05-20 | 2018-05-31 |
|---|
| 2014 SU349[b] | 64.2 | 61.0 | +0.59 | 28.5 | 157.0 | 92.8 | 25.4 | 7.2 | 2014-09-18 | 2016-08-31 |
|---|
| 2013 AT183 | 63.4 | 61.8 | +0.33 | 35.5 | 87.7 | 61.6 | 23.0 | 4.9 | 2013-01-10 | 2016-07-26 |
|---|
2000 CR105
148209 | 63.3 | 60.4 | +0.53 | 44.1 | 388.1 | 216.1 | 24.1 | 6.3 | 2000-02-06 | 2000-03-16 |
|---|
| 2015 RL258 | 62.9 | 63.8 | –0.15 | 34.4 | 67.5 | 50.9 | 24.6 | 6.5 | 2015-09-07 | 2018-03-12 |
|---|
| 2018 AH39 | 62.9 | 62.4 | +0.09 | 44.6 | 65.9 | 55.2 | 25.2 | 7.2 | 2018-01-15 | 2021-02-14 |
|---|
| 2020 BR60[b] | 62.4 | 62.9 | –0.09 | 36.6 | 64.2 | 50.4 | 24.9 | 7.0 | 2020-01-26 | 2021-02-23 |
|---|
| 2015 VG157 | 62.3 | 61.3 | +0.18 | 39.0 | 68.9 | 54.0 | 25.5 | 7.5 | 2015-11-07 | 2018-03-14 |
|---|
| 2019 EA5 | 62.3 | 60.2 | +0.37 | 38.3 | 100.8 | 69.6 | 24.7 | 6.7 | 2019-03-06 | 2021-02-14 |
|---|
| 2015 KF172 | 62.2 | 64.2 | –0.37 | 38.1 | 101.4 | 69.8 | 23.7 | 5.5 | 2015-05-20 | 2018-05-31 |
|---|
| 2018 VO137 | 62.2 | 62.8 | –0.11 | 44.6 | 65.9 | 55.2 | 25.4 | 7.3 | 2018-11-08 | 2021-02-14 |
|---|
2008 ST291
528381 | 62.1 | 59.7 | +0.44 | 42.4 | 158.8 | 100.6 | 22.4 | 4.4 | 2008-09-24 | 2009-11-14 |
|---|
| 2018 AX18 | 62.0 | 62.8 | –0.16 | 36.8 | 67.4 | 52.1 | 24.7 | 6.6 | 2018-01-15 | 2019-02-10 |
|---|
| 2017 DP121 | 61.9 | 59.8 | +0.39 | 40.6 | 60.4 | 50.5 | 25.2 | 7.2 | 2017-02-24 | 2018-04-02 |
|---|
| 2017 VO34 | 61.9 | 62.9 | –0.19 | 35.2 | 68.8 | 52.0 | 25.4 | 7.3 | 2017-11-15 | 2019-03-27 |
|---|
| 2015 RH278 | 61.7 | 63.2 | –0.27 | 34.3 | 76.7 | 55.5 | 25.4 | 7.2 | 2015-09-08 | 2018-10-02 |
|---|
2015 RR245
523794 | 61.7 | 64.4 | –0.48 | 34.1 | 129.4 | 81.7 | 22.2 | 3.8 | 2015-09-09 | 2016-07-10 |
|---|
| 2017 FD163 | 61.7 | 60.8 | +0.16 | 30.1 | 65.0 | 47.5 | 24.9 | 6.9 | 2017-03-25 | 2019-03-27 |
|---|
| 2014 FM72 | 61.2 | 59.7 | +0.29 | 34.1 | 76.8 | 55.5 | 24.2 | 6.2 | 2014-03-25 | 2016-08-31 |
|---|
| 2015 GW55 | 61.0 | 58.2 | +0.51 | 34.0 | 136.7 | 85.3 | 24.6 | 6.7 | 2015-04-13 | 2018-10-03 |
|---|
| 2016 TO120 | 60.8 | 59.4 | +0.27 | 40.1 | 80.5 | 60.3 | 25.3 | 7.3 | 2016-10-06 | 2020-06-03 |
|---|
| 2014 SV349 | 60.6 | 62.5 | –0.34 | 34.0 | 90.0 | 62.0 | 23.1 | 5.2 | 2014-09-19 | 2016-08-31 |
|---|
| 2014 FF72 | 60.6 | 59.9 | +0.14 | 36.7 | 64.0 | 50.4 | 24.8 | 6.9 | 2014-03-24 | 2016-08-31 |
|---|
| 2015 FU403 | 60.5 | 58.8 | +0.31 | 35.2 | 80.8 | 58.0 | 25.6 | 7.5 | 2015-03-17 | 2018-03-12 |
|---|
| 2015 KH162 | 60.5 | 59.0 | +0.27 | 41.6 | 82.5 | 62.1 | 22.1 | 4.1 | 2015-05-18 | 2016-02-23 |
|---|
| 2018 JT6 | 60.5 | 61.1 | –0.10 | 42.8 | 63.8 | 53.3 | 24.6 | 6.8 | 2018-05-10 | 2019-03-27 |
|---|
| 2016 TP120 | 60.5 | 63.6 | –0.57 | 39.9 | 307.0 | 173.4 | 25.1 | 7.1 | 2016-10-07 | 2020-06-04 |
|---|
| 2013 JQ64 | 60.4 | 58.3 | +0.37 | 22.5 | 75.6 | 49.1 | 24.3 | 6.2 | 2013-05-08 | 2015-09-13 |
|---|
| 2003 QX113 | 60.4 | 59.9 | +0.10 | 37.5 | 62.3 | 49.9 | 22.9 | 5.1 | 2003-08-31 | 2006-04-22 |
|---|
| 2017 OK69 | 60.3 | 61.1 | –0.15 | 36.3 | 65.1 | 50.7 | 23.8 | 5.8 | 2017-07-26 | 2019-03-27 |
|---|
| 2016 TN120 | 60.2 | 60.6 | –0.07 | 43.7 | 61.8 | 52.8 | 24.4 | 6.4 | 2016-10-06 | 2020-06-03 |
|---|
| 2018 VP137 | 60.0 | 61.8 | –0.32 | 33.0 | 81.1 | 57.0 | 25.6 | 7.7 | 2018-11-08 | 2021-02-14 |
|---|
| This table includes all observable objects currently located at least 60 AU from the Sun.[3] |
These Solar System minor planets are the farthest from the Sun as of June 2021. The objects have been categorized by their approximate current distance from the Sun, and not by the calculated aphelion of their orbit. The list changes over time because the objects are moving. Some objects are inbound and some are outbound. It would be difficult to detect long-distance comets if it were not for their comas, which become visible when heated by the Sun. Distances are measured in astronomical units (AU, Sun–Earth distances). The distances are not the minimum (perihelion) or the maximum (aphelion) that may be achieved by these objects in the future.
Positions of known outer Solar System objects
Sun
Jupiter trojans (6,178)
Scattered disc (>300) Giant planets: J · S · U · N
Centaurs (44,000)
Kuiper belt (>1,000)
(scale in AU; epoch as of January 2015; # of objects in parentheses)
This list does not include near-parabolic comets of which many are known to be currently more than 100 AU (15 billion km) from the Sun, but are currently too far away to be observed by telescope. Trans-Neptunian objects are typically announced publicly months or years after their discovery, so as to make sure the orbit is correct before announcing it. Due to their greater distance from the Sun and slow movement across the sky, trans-Neptunian objects with observation arcs less than several years often have poorly constrained orbits. Particularly distant objects take several years of observations to establish a crude orbit solution before being announced. For instance, the most distant known trans-Neptunian object 2018 AG37 was discovered by Scott Sheppard in January 2018 but was announced three years later in February 2021.[1]
Noted objectsEditOne particularly distant body is 90377 Sedna, which was discovered in November 2003. Although it takes over 10,000 years to orbit, during the next 50 years it will slowly move closer to the Sun as it comes to perihelion at a distance of 76 AU from the Sun.[2] Sedna is the largest known sednoid, a class of objects that play an important role in the Planet Nine hypothesis.
Pluto (30–49 AU, about 34 AU in 2015) was the first Kuiper belt object to be discovered (1930) and is the largest known dwarf planet.
GalleryEdit- Notable trans-Neptunian objects
Halley's Comet imaged by the VLT at magnitude 28 when the object was located 28 AU from the Sun in 2003
Eris and its moon Dysnomia as viewed with the Hubble Space Telescope, 2007
Makemake viewed with the Hubble Space Telescope, 2006
Sedna viewed with Hubble Space Telescope, 2004
The orbit of Sedna, shown in red, with the dot marking its current location. Inside are the orbits of the giant planets of the Solar System, and that of Pluto in purple. Sedna will travel out nearly 1000 AU, taking almost six millennia to do so. It is currently less than 100 AU from the Sun.
This is a list of known objects at heliocentric distances of more than 60 AU. In theory, the Oort Cloud could extend over 120,000 AU (2 ly) from the Sun.
Most distant observable objects in the Solar System as of June 2021[3]| Object name | Distance from the Sun (AU) | Radial velocity
(AU/yr)[a] | Perihelion | Aphelion | Semimajor
axis | Apparent
magnitude | Absolute
magnitude (H) | Important dates |
|---|
| June 2021 | December 2015 | Discovered | Announced |
|---|
Great Comet of 1680
(for comparison) | 258.0[4] | 255.4[4] | +0.47[4] | 0.006 | 889 | 444 | Unknown | Unknown | 1680-11-14 | n/a |
Voyager 1
(for comparison) | 152.9[4] | 133.3[4] | +3.57[4] | 8.90 | ∞
Hyperbolic | −3.2[5] | ~50 | ~28 | n/a | n/a |
| 2018 AG37 | 132.9±1.8 | 131.9±10.7 | ±0.2(?) | 27.1 | 145.0 | 86.0 | 25.4 | 4.2 | 2018-01-15 | 2021-02-10 |
|---|
Pioneer 10
(for comparison) | 128.6[4] | 114.8[4] | +2.51[4] | 4.94 | ∞
Hyperbolic | | ~49 | ~29 | n/a | n/a |
Voyager 2
(for comparison) | 127.2[4] | 109.7[4] | +3.17[4] | 21.2 | ∞
Hyperbolic | −4.0[5] | ~48 | ~28 | n/a | n/a |
| 2018 VG18 | 123.6 | 123.2 | +0.06 | 37.8 | 123.9 | 81.3 | 24.6 | 3.7 | 2018-11-10 | 2018-12-17 |
|---|
Pioneer 11
(for comparison) | 105.5[4] | 92.5[4] | +2.35[4] | 9.45 | ∞
Hyperbolic | | ~48 | ~29 | n/a | n/a |
| 2020 FY30 | 98.9 | 99.9 | –0.17 | 35.6 | 107.7 | 71.6 | 24.8 | 4.7 | 2020-03-24 | 2021-02-14 |
|---|
| 2020 FA31 | 97.3 | 96.5 | +0.14 | 39.5 | 102.4 | 71.0 | 25.4 | 5.4 | 2020-03-24 | 2021-02-14 |
|---|
Eris
136199 | 95.9 | 96.3 | −0.07 | 38.3 | 97.5 | 67.9 | 18.8 | −1.1 | 2003-10-21 | 2005-07-29 |
|---|
| 2015 TH367[b] | 90.3 | 88.2 | +0.42 | 28.9 | 136.4 | 82.6 | 26.3 | 6.6 | 2015-10-13 | 2018-03-13 |
|---|
| 2014 UZ224 | 89.5 | 92.0 | −0.45 | 38.3 | 177.0 | 107.6 | 23.2 | 3.4 | 2014-10-21 | 2016-08-28 |
|---|
Gonggong
225088 | 88.7 | 87.4 | +0.23 | 33.7 | 101.2 | 67.5 | 21.5 | 1.6 | 2007-07-17 | 2009-01-07 |
|---|
| 2015 FG415 | 87.2 | 87.9 | −0.14 | 36.2 | 92.1 | 64.1 | 25.5 | 6.0 | 2015-03-17 | 2019-03-27 |
|---|
| 2014 FC69 | 85.5 | 84.1 | +0.26 | 40.4 | 104.4 | 72.4 | 24.2 | 4.6 | 2014-03-25 | 2015-02-11 |
|---|
| 2006 QH181 | 84.6 | 83.3 | +0.22 | 37.5 | 96.7 | 67.1 | 23.7 | 4.3 | 2006-08-21 | 2006-11-05 |
|---|
Sedna
90377 | 84.2 | 85.8 | −0.29 | 76.3 | 892.6 | 484.4 | 21.0 | 1.3 | 2003-11-14 | 2004-03-15 |
|---|
| 2015 VO166 | 84.3 | 82.5 | +0.32 | 38.3 | 113.2 | 75.8 | 25.5 | 5.9 | 2015-11-06 | 2018-10-02 |
|---|
| 2012 VP113 | 84.2 | 83.3 | +0.16 | 80.4 | 442.6 | 261.5 | 23.5 | 4.0 | 2012-11-05 | 2014-03-26 |
|---|
| 2013 FS28 | 83.5 | 85.9 | −0.62 | 34.2 | 358.2 | 196.2 | 24.3 | 4.9 | 2013-03-16 | 2016-08-29 |
|---|
| 2017 SN132 | 82.8 | 80.4 | +0.44 | 42.0 | 110.0 | 76.0 | 25.2 | 5.8 | 2017-09-16 | 2019-02-10 |
|---|
| 2015 UH87[b] | 81.3 | 82.3 | −0.19 | 34.3 | 90.0 | 62.2 | 25.2 | 6.0 | 2015-10-16 | 2018-03-12 |
|---|
2013 FY27
532037 | 79.7 | 80.3 | −0.10 | 35.2 | 82.1 | 58.7 | 22.2 | 3.2 | 2013-03-17 | 2014-03-31 |
|---|
| 2015 TJ367[b] | 79.4 | 77.1 | +0.42 | 33.6 | 128.1 | 80.9 | 25.8 | 6.7 | 2015-10-13 | 2018-03-13 |
|---|
| 2017 FO161 | 78.1 | 79.1 | −0.18 | 34.1 | 85.5 | 59.8 | 23.3 | 4.3 | 2017-03-23 | 2018-04-02 |
|---|
Leleākūhonua
541132 | 77.6 | 79.8 | −0.40 | 65.2 | 2,106 | 1,085 | 24.6 | 5.5 | 2015-10-13 | 2018-10-01 |
|---|
| 2018 AD39 | 77.2 | 74.1 | –0.58 | 38.4 | 287.9 | 163.2 | 25.0 | 6.2 | 2018-01-15 | 2021-02-13 |
|---|
| 2020 FB31 | 75.8 | 76.8 | –0.19 | 34.4 | 83.3 | 59.1 | 24.5 | 5.6 | 2020-03-24 | 2021-02-14 |
|---|
| 2018 AK39 | 75.3 | 75.4 | –0.01 | 27.3 | 75.4 | 51.4 | 25.3 | 6.5 | 2018-01-18 | 2021-02-18 |
|---|
| 2010 GB174 | 73.6 | 70.7 | +0.54 | 48.7 | 630.7 | 339.7 | 25.3 | 6.5 | 2010-04-12 | 2013-04-30 |
|---|
| 2015 VJ168 | 73.4 | 72.4 | +0.19 | 37.6 | 81.5 | 59.5 | 24.8 | 5.8 | 2015-11-06 | 2018-10-03 |
|---|
| 2014 FJ72 | 72.6 | 70.1 | +0.46 | 38.4 | 148.2 | 93.3 | 24.4 | 5.6 | 2014-03-24 | 2016-08-31 |
|---|
| 2016 TS97[b] | 71.2 | 71.5 | −0.04 | 36.2 | 71.7 | 54.0 | 24.9 | 6.1 | 2016-10-06 | 2018-04-02 |
|---|
| 2015 GN55 | 71.0 | 72.1 | −0.19 | 32.5 | 78.4 | 55.5 | 24.6 | 5.8 | 2015-04-13 | 2018-09-02 |
|---|
| 2015 VL168 | 69.7 | 72.1 | –0.44 | 37.7 | 136.0 | 86.8 | 24.7 | 6.1 | 2015-11-07 | 2018-10-03 |
|---|
| 2015 RZ277 | 69.3 | 67.5 | +0.32 | 34.7 | 90.5 | 62.6 | 25.6 | 6.8 | 2015-09-08 | 2018-10-01 |
|---|
| 2012 FH84 | 68.8 | 68.4 | +0.07 | 41.9 | 70.1 | 56.0 | 25.8 | 7.2 | 2012-03-25 | 2016-06-07 |
|---|
| 2019 AC77 | 68.7 | 69.9 | –0.21 | 35.0 | 79.0 | 57.0 | 25.0 | 6.6 | 2019-01-11 | 2021-02-14 |
|---|
| 2015 GR50 | 68.6 | 68.2 | +0.07 | 38.2 | 69.7 | 54.0 | 25.2 | 6.6 | 2015-04-13 | 2016-08-31 |
|---|
| 2013 FQ28 | 68.4 | 67.3 | +0.19 | 45.6 | 80.0 | 62.7 | 24.5 | 6.0 | 2013-03-17 | 2016-06-07 |
|---|
| 2011 GM89 | 68.3 | 68.5 | –0.24 | 36.5 | 68.8 | 52.7 | 25.7 | 7.1 | 2011-04-04 | 2016-08-31 |
|---|
| 2015 GP50 | 67.6 | 68.1 | –0.10 | 40.4 | 70.0 | 55.2 | 25.0 | 6.5 | 2015-04-14 | 2016-06-07 |
|---|
| 2016 CD289 | 67.2 | 66.2 | +0.18 | 37.5 | 74.0 | 55.8 | 25.7 | 7.3 | 2016-02-05 | 2018-03-13 |
|---|
| 2018 VJ137 | 67.2 | 69.7 | –0.46 | 37.8 | 139.3 | 88.5 | 25.2 | 6.9 | 2018-01-15 | 2021-02-13 |
|---|
| 2014 UD228 | 66.7 | 65.7 | +0.18 | 36.7 | 73.3 | 55.0 | 24.5 | 6.1 | 2014-10-22 | 2017-12-07 |
|---|
| 2016 GB277 | 66.2 | 68.3 | –0.39 | 40.0 | 119.4 | 79.7 | 25.6 | 7.3 | 2016-04-10 | 2020-06-04 |
|---|
| 2016 GZ276 | 66.1 | 69.2 | –0.56 | 38.6 | 253.6 | 146.1 | 25.3 | 7.0 | 2016-04-10 | 2020-06-03 |
|---|
| 2014 FL72 | 66.1 | 63.3 | +0.50 | 38.0 | 167.1 | 102.5 | 25.1 | 6.8 | 2014-03-26 | 2016-08-31 |
|---|
| 2016 TQ120[b] | 65.8 | 63.7 | +0.37 | 42.3 | 114.3 | 78.3 | 25.0 | 6.7 | 2016-10-06 | 2020-06-04 |
|---|
| 2015 RQ281 | 65.7 | 62.7 | +0.56 | 36.9 | 210.6 | 123.8 | 25.1 | 6.8 | 2015-09-05 | 2019-03-27 |
|---|
| 2020 BS60[b] | 65.7 | 68.0 | –0.42 | 31.0 | 104.1 | 67.6 | 24.6 | 6.5 | 2020-01-26 | 2021-02-23 |
|---|
| 2013 UJ15 | 65.4 | 64.8 | +0.11 | 37.2 | 67.4 | 52.3 | 25.4 | 7.0 | 2013-10-28 | 2016-08-31 |
|---|
| 2014 FD70 | 65.2 | 63.8 | +0.26 | 35.9 | 78.6 | 57.3 | 25.1 | 6.9 | 2014-03-25 | 2018-04-02 |
|---|
| 2018 AZ18 | 65.1 | 65.9 | –0.15 | 39.1 | 70.5 | 54.8 | 26.0 | 7.7 | 2018-01-15 | 2019-03-27 |
|---|
| 2015 KV167 | 65.0 | 65.2 | –0.03 | 38.0 | 65.3 | 51.6 | 25.6 | 7.2 | 2015-05-18 | 2018-03-13 |
|---|
| 2018 VO35 | 65.0 | 67.8 | –0.51 | 35.2 | 152.2 | 93.7 | 24.9 | 6.8 | 2018-11-10 | 2019-02-10 |
|---|
| 2014 FE72 | 64.8 | 60.8 | +0.72 | 36.3 | 2,682 | 1,359 | 24.4 | 6.1 | 2014-03-26 | 2016-08-29 |
|---|
| 2015 KG172 | 64.5 | 63.6 | +0.16 | 41.2 | 70.1 | 55.7 | 24.4 | 6.1 | 2015-05-20 | 2018-05-31 |
|---|
| 2014 SU349[b] | 64.2 | 61.0 | +0.59 | 28.5 | 157.0 | 92.8 | 25.4 | 7.2 | 2014-09-18 | 2016-08-31 |
|---|
| 2013 AT183 | 63.4 | 61.8 | +0.33 | 35.5 | 87.7 | 61.6 | 23.0 | 4.9 | 2013-01-10 | 2016-07-26 |
|---|
2000 CR105
148209 | 63.3 | 60.4 | +0.53 | 44.1 | 388.1 | 216.1 | 24.1 | 6.3 | 2000-02-06 | 2000-03-16 |
|---|
| 2015 RL258 | 62.9 | 63.8 | –0.15 | 34.4 | 67.5 | 50.9 | 24.6 | 6.5 | 2015-09-07 | 2018-03-12 |
|---|
| 2018 AH39 | 62.9 | 62.4 | +0.09 | 44.6 | 65.9 | 55.2 | 25.2 | 7.2 | 2018-01-15 | 2021-02-14 |
|---|
| 2020 BR60[b] | 62.4 | 62.9 | –0.09 | 36.6 | 64.2 | 50.4 | 24.9 | 7.0 | 2020-01-26 | 2021-02-23 |
|---|
| 2015 VG157 | 62.3 | 61.3 | +0.18 | 39.0 | 68.9 | 54.0 | 25.5 | 7.5 | 2015-11-07 | 2018-03-14 |
|---|
| 2019 EA5 | 62.3 | 60.2 | +0.37 | 38.3 | 100.8 | 69.6 | 24.7 | 6.7 | 2019-03-06 | 2021-02-14 |
|---|
| 2015 KF172 | 62.2 | 64.2 | –0.37 | 38.1 | 101.4 | 69.8 | 23.7 | 5.5 | 2015-05-20 | 2018-05-31 |
|---|
| 2018 VO137 | 62.2 | 62.8 | –0.11 | 44.6 | 65.9 | 55.2 | 25.4 | 7.3 | 2018-11-08 | 2021-02-14 |
|---|
2008 ST291
528381 | 62.1 | 59.7 | +0.44 | 42.4 | 158.8 | 100.6 | 22.4 | 4.4 | 2008-09-24 | 2009-11-14 |
|---|
| 2018 AX18 | 62.0 | 62.8 | –0.16 | 36.8 | 67.4 | 52.1 | 24.7 | 6.6 | 2018-01-15 | 2019-02-10 |
|---|
| 2017 DP121 | 61.9 | 59.8 | +0.39 | 40.6 | 60.4 | 50.5 | 25.2 | 7.2 | 2017-02-24 | 2018-04-02 |
|---|
| 2017 VO34 | 61.9 | 62.9 | –0.19 | 35.2 | 68.8 | 52.0 | 25.4 | 7.3 | 2017-11-15 | 2019-03-27 |
|---|
| 2015 RH278 | 61.7 | 63.2 | –0.27 | 34.3 | 76.7 | 55.5 | 25.4 | 7.2 | 2015-09-08 | 2018-10-02 |
|---|
2015 RR245
523794 | 61.7 | 64.4 | –0.48 | 34.1 | 129.4 | 81.7 | 22.2 | 3.8 | 2015-09-09 | 2016-07-10 |
|---|
| 2017 FD163 | 61.7 | 60.8 | +0.16 | 30.1 | 65.0 | 47.5 | 24.9 | 6.9 | 2017-03-25 | 2019-03-27 |
|---|
| 2014 FM72 | 61.2 | 59.7 | +0.29 | 34.1 | 76.8 | 55.5 | 24.2 | 6.2 | 2014-03-25 | 2016-08-31 |
|---|
| 2015 GW55 | 61.0 | 58.2 | +0.51 | 34.0 | 136.7 | 85.3 | 24.6 | 6.7 | 2015-04-13 | 2018-10-03 |
|---|
| 2016 TO120 | 60.8 | 59.4 | +0.27 | 40.1 | 80.5 | 60.3 | 25.3 | 7.3 | 2016-10-06 | 2020-06-03 |
|---|
| 2014 SV349 | 60.6 | 62.5 | –0.34 | 34.0 | 90.0 | 62.0 | 23.1 | 5.2 | 2014-09-19 | 2016-08-31 |
|---|
| 2014 FF72 | 60.6 | 59.9 | +0.14 | 36.7 | 64.0 | 50.4 | 24.8 | 6.9 | 2014-03-24 | 2016-08-31 |
|---|
| 2015 FU403 | 60.5 | 58.8 | +0.31 | 35.2 | 80.8 | 58.0 | 25.6 | 7.5 | 2015-03-17 | 2018-03-12 |
|---|
| 2015 KH162 | 60.5 | 59.0 | +0.27 | 41.6 | 82.5 | 62.1 | 22.1 | 4.1 | 2015-05-18 | 2016-02-23 |
|---|
| 2018 JT6 | 60.5 | 61.1 | –0.10 | 42.8 | 63.8 | 53.3 | 24.6 | 6.8 | 2018-05-10 | 2019-03-27 |
|---|
| 2016 TP120 | 60.5 | 63.6 | –0.57 | 39.9 | 307.0 | 173.4 | 25.1 | 7.1 | 2016-10-07 | 2020-06-04 |
|---|
| 2013 JQ64 | 60.4 | 58.3 | +0.37 | 22.5 | 75.6 | 49.1 | 24.3 | 6.2 | 2013-05-08 | 2015-09-13 |
|---|
| 2003 QX113 | 60.4 | 59.9 | +0.10 | 37.5 | 62.3 | 49.9 | 22.9 | 5.1 | 2003-08-31 | 2006-04-22 |
|---|
| 2017 OK69 | 60.3 | 61.1 | –0.15 | 36.3 | 65.1 | 50.7 | 23.8 | 5.8 | 2017-07-26 | 2019-03-27 |
|---|
| 2016 TN120 | 60.2 | 60.6 | –0.07 | 43.7 | 61.8 | 52.8 | 24.4 | 6.4 | 2016-10-06 | 2020-06-03 |
|---|
| 2018 VP137 | 60.0 | 61.8 | –0.32 | 33.0 | 81.1 | 57.0 | 25.6 | 7.7 | 2018-11-08 | 2021-02-14 |
|---|
| This table includes all observable objects currently located at least 60 AU from the Sun.[3] |
- ^ AU/yr indicates whether the object is moving inwards or outwards in its orbit, and the rate at which it does so.
- ^ a b c d e f g h Distance and orbital elements are crudely estimated based on a short observation arc.


